Fertilization trial in coffee: Soluble NPK replaces granular NPK in half the dose
The following is a selection of scientific research demonstrating the effect of nutrients and nutritional imbalances on coffee yield and quality, as well as the importance of choosing the appropriate specialty plant nutrition (SPN) products.
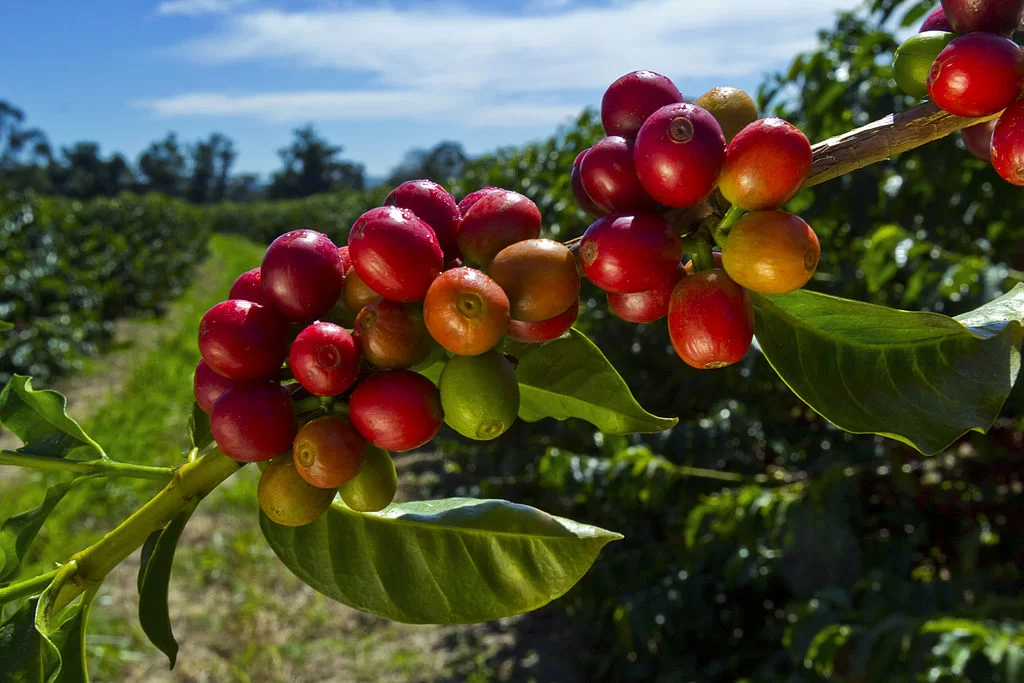
The following is a selection of scientific research demonstrating the effect of nutrients and nutritional imbalances on coffee yield and quality, as well as the importance of choosing the appropriate specialty plant nutrition (SPN) products.
With the aim of evaluating the response of coffee crops to the application of different sources of NPK fertilizers, both granular and soluble, in reduced doses, a field trial was conducted at the Hamburgo Coffee Farm, located in Tapachula, Chiapas, Mexico.
Trial Design: Catuai coffee with reduced NPK doses
The research focused on the Catuai variety, stumped in 2009, with a density of 3,600 plants per hectare.
The study aimed to measure coffee crop yields under different fertilization strategies, focusing on the efficient use of nutrients.
Treatment Structure
The treatments evaluated included different sources of NPK, both granular and soluble, and were applied in split doses, at two key moments in the crop cycle.
| Treatment | Formula | Fertilizer type | Dose | N-total | N-NO3 | N-NH4 | N-NH3 | P2O5 | K2O | CaO | MgO | |
|---|---|---|---|---|---|---|---|---|---|---|---|---|
| Kg/há | Kg/há | Source | Kg/há | |||||||||
| T1 | 22-6-21+2%CaO+2%MgO | Granular | 251 | 55 | 6 | 49 | 15 | 52 | KCl | 6 | 6 | |
| T2 | 19-5-18+2%CaO+2%MgO | 291 | 55 | 30 | 25 | 15 | 52 | KNO3 | 6 | 6 | ||
| T3 | 18-5-17+2%CaO+2%MgO | Water soluble | 306 | 55 | 30 | 25 | 15 | 52 | Ultrasol® NKS | 6 | 6 | |
| T4 (75%*T3) | 18-5-17+2%CaO+2%MgO | 230 | 41 | 23 | 19 | 12 | 39 | Ultrasol® NKS | 5 | 5 | ||
| T5 (50%*T3) | 18-5-17+2%CaO+2%MgO | 153 | 28 | 15 | 12 | 8 | 26 | Ultrasol® NKS | 3 | 3 | ||
Cuadro 1. Los tratamientos NPK.
The treatments were applied manually in accordance with the farm’s standard practice. Treatments T1 and T2 were applied with granular fertilizers (Fig. 1), while T3, T4 and T5 with water-soluble fertilizers (Fig. 2).
The fertilization variants under study comprised 5 treatments that were arranged in a completely randomized design with 10 replicates each. The experimental unit was the plant. Three manual harvests were conducted: the first on November 18th, 2011, the second on December 19th, 2011, and the third on January 18th, 2012.
Agronomic analysis and conclusions
The fruit yield for each treatment (Fig. 3) was analyzed using analysis of variance and the differences between the means, using the LSD test.
Only a significant difference (P = 0.05) was found between treatments T3 and T5. Nevertheless, it should be noted that T5 achieved the highest yield, considering that only 50% of the N-P-K-Ca and Mg units were applied, whereas in T1, T2, and T3, 100% were applied.
Additionally, it should be highlighted that T3 was severely affected by the disease “ojo de gallo” (Mycena citricolor), which reduced T3’s yield.
Related newsSee all news →




Rate certificates
Beginning with tax year 2020, Professional Fees Certificates must be requested by email, indicating your name and national identity card number.
Email us at [email protected] to access this information.

Supplier consultation
Dear suppliers:
If you have any questions regarding Purchase Orders (POs), please send us the document in PDF or JPG format (photograph) to the following email address: [email protected].
Please ensure that the PO is legible, especially the following fields: Company Name, order number, and the buyer’s name and contact details.
We will respond to your inquiries within 24 hours.